ASP.NET Page LifeCycle X-Ray’d

August 1, 2008 by

There are many good articles on the web covering ASP.NET Page LifeCycle – published my Microsoft on MSDN or by professionals in .NET related blogs. dynaTrace allowed me to dive deeper into the Page LifeCycle seeing the impact of my implemented OnInit, OnPreRender, … methods of my pages, web parts and controls when my application actually runs under production load.

In order to do Application Performance Management you have to understand all the libraries, frameworks and 3rd party software that you use in your application. ASP.NET is the main framework that you work. So you better understand what is going on when a page request is executed in order to know where not to do costly code executions.

ASP.NET Extended Knowledge Sensor

I’ve created a new Knowledge Sensor Pack that extends the out of the box ASP.NET Sensors. It includes support for ASP.NET Pages, WebParts, Custom Controls and ViewState handling. Using this KSP to analyse DotNetPay – dynaTrace’s .NET Sample Application – gives us the following diagnostics information:

API Breakdown

Performing a Outside-In Diagnose I start with the API Breakdown. The API Breakdown shows us the main performance contributors of an ASP.NET Page Request:

ASP.NET Page Request API Breakdown

ASP.NET Page Request API Breakdown

I can see the performance broken down into the different layes:

  • ASP.NET WebPage
  • ASP.NET UserControls
  • ASP.NET ViewState
  • and general ASP.NET

It turns out that my custom ASP.NET Controls have a major impact on the overall performance.

Identifying poor performing Custom ASP.NET Controls

From the API Breakdown View I switch to the Method View. This view allows us to get an overview of those methods that actually contribute to the bad performance.

List of custom ASP.NET methods

List of custom ASP.NET methods

From an individual method we can then get to the PurePath to analyse the reason of the bad performance

Analysing root cause of slow custom ASP.NET Controls

The PurePath shows us where in the ASP.NET Page LifeCycle my custom control was actually executed and why the overall execution time of this control was slow

Shows the PurePath of slow performing Custom ASP.NET Control

Shows the PurePath of slow performing Custom ASP.NET Control

Conclusion 

Getting insight into the used frameworks is crucial for you in order to write performing and scalable applications. dynaTrace gives you the option to see behind the curtains.

ASP.NET GridView Performance

July 10, 2008 by
ASP.NET offers a powerful GridView control that can be used to display data from different data sources, e.g.: SQLServer, LINQ, XML, …  The control additionally supports features like paging, sorting and editing.

Visual Studio makes it very easy to use this control on your web page and to bind it to a data source like a SQL Server table. It only takes several drag&drop operations on your page and a few more clicks to configure which data you want to display and which features of the GridView you want to enable.

This easy-to-use approach is nice and it works well for many use case scenarios. From our experience we however know that easy-to-use and flexible components are not always concluding in high performance.

The Sample Implementation: 3 different ways to use a GridView control

I’ve created a sample ASP.NET Web Site with 3 different pages. Each page hosts a GridView control to display the content of the Northwind Products Table. I added 10000 additional product records in order to show a more real-life scenario than to query a table with only a few records.

The difference between the 3 pages is the underlying data source:

  • The first page used a standard SQL Data Source
  • The second page used the same SQL Data Source but enabled Data Caching for 5 seconds
  • The third page used the new Entity Data Source.

All of the Grid Views support Paging, Editing, Selection and Deletion.

The Performance Test

I ran a simple load test on each of the individual pages. The workload was a 20 user load test over 5 minutes where each user executed the following actions:

  • queried the initial page
  • sorted the grid by product column
  • clicked through 3 different grid pages
  • sorted the product column again

The Performance Results

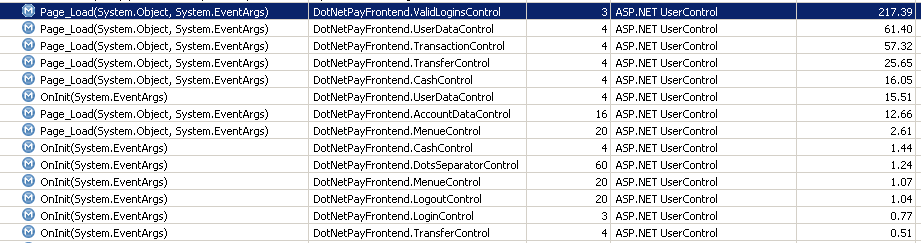
I used dynaTrace to analyze the individual load test requests in terms of their database access and rendering activities.

Grid with standard ADO.NET Binding
It turned out that a GridView with a standard SQL Data Source is ALWAYS selecting ALL rows (SELECT * FROM Products) of the underlying table – even if the PageSize is smaller than the actual result set.

 Additionally – sorting is not done on the SQL Layer. The GridView is again retrieving ALL rows from the database (SELECT * FROM Products) and is then performing an In-Memory sort on the resultset. In my scenario – each page request executed a SQL Statement that returned more than 10000 rows although only 10 elements (that was the PageSize) were displayed.

Grid with standard ADO.NET Data Binding using Client Side Caching
Enabling Data Caching on the SQL Data Source of course limited the round trips to the database on my second page and therefore improved the overall performance. The Caching implementation is smart enough to already cache the sorted/paged data.

GridView with Entity Framework Data Source
Using the Entity Data Source on SQL Server turned out to be the best performing solution. Each page request actually resulted in two SQL Statements. One that queried that row identifiers to display based on the current page index and the other one to actually query ONLY THOSE rows that were actually displayed based on Page Index and Sorted Column. This scenario therefore limited the number of data that had to be retrieved from the database. Although more SQL Statements were executed on the database – the overall performance was improved by a large factor.

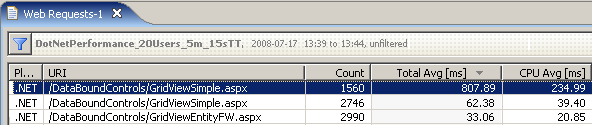
Following image shows the Web Requests that performed a request on the second data page.  Once on the GridView with standard data binding and once using ADO.NET Entity Framework.

Web Requests to 2 different Grid Pages

Web Requests to 2 different Grid Pages

For each individual Web Request we can see the resulting SQL Statements. Simple ADO.NET Data Mapping executes a full table select on each page request:

Database View showing SQL Statements of ADO.NET Data Binding

Database View showing SQL Statements of ADO.NET Data Binding

ADO.NET Entity Framework executes statements that just retrieve the data that must be displayed. This implies more work on the database but less work in ASP.NET to render and filter the data:

Database View showing SQL Statments for ADO.NET Entity Framework Binding

Database View showing SQL Statments for ADO.NET Entity Framework Binding

The Analysis

The following table compares individual measures from the 3 scenarios. We can see that twice as many requests could be handled by the page that used the Entity Data Source with only 1/10 of CPU usage and with an average response time that was 24 times faster compared to the SQL Data Source without caching.

Web Request View comparing all 3 Scenarios

Web Request View comparing all 3 Scenarios

The most critical performance impact in this scenario was that the SQL Data Source just requested TO MUCH data that had to be transfered from the database to the web applications. All this data than had to be processed where only a small part of it was actually displayed to the user.

Conclusion

ONLY REQUEST THE DATA THAT YOU NEED

Performance Antipattern : Logical Structure vs. Physical Deployment

July 9, 2008 by

A very common performance anti-pattern is wrong deployment of components. This often comes when applications are deployed as they are designed at a conceptual leve. Most web-based applications today are build based on the Model-View-Controller concept. This means that components are seperated into :

  • A view part responsible for presenting a user interface to the end user.
  • A controller part containing the interaction logical as well as business logic.
  • A model part consisting of the actual data and some logical relations in the data.

When it comes to deployment a very frequently chosen scenario is splitting the system into a frontend system and a backend system. Especially for J EE applications this is a typical deployment scenario.

In some situations this deployment approach may cause a serious performance problem. This is specially true for data-intensive applications. In a modern application we might run into a situation as shown below. We have a data-intensive task which retrieves data from the database processes it in business components and then forwards the information to the user.

Multi Tier Deployment

Multi Tier Deployment


By moving the all logic we need for this task on one server we can reduce the amout of data sent over the network as well as the CPU load required for serialization and deserialization. Additionally the number of objects that have to be created can massivley be reduced. Serialization also requires interim objects to be created e.g. when converting an object model into an XML structure or the other way round.

The dynaTrace Remoting and WebServices Views provide an excellent way for anaylzing remoting overhead on a transactional basis. This information is vital for identifying these kinds of deployment problems. Below there is a sample of a web service including the data amount transferred as well as networking and remoting times.

dynaTrace Remoting and Web Service Views

dynaTrace Remoting and Web Service Views


SharePoint ListItem Performance

July 7, 2008 by

SharePoint provides a powerful object model to retrieve and manipulate data stored in SharePoint Lists. Its possible to query the data by retrieving all content from a list or view – or by executing a so called CAML (Collaborative Markup Language) Query

Real-Life GetItemById Problem
I’ve recently been working with a customer who faced performance problems with their custom developed web parts. The Web Parts allowed a user to view and manipulate account information which was stored in different SharePoint lists.It seemed the page got slower the more accounts where stored in the lists. When a user clicked to view the account details the information was queried and displayed. When we analyzed the request we immediatelly saw the problem.

The SPListItemCollection.GetItemById was used with the assumption that only the data for the requested Item was queried from the database. However – using GetItemById on the Items Property of an SPList object in fact queries ALL items from the database. Then the resultset is filtered in memory to only return the requested item.

The Solution
Changing this request to a call to SPList.GetItems(camlQuery) improved the call performance tremendously.

Just with this change we improved the performance of the WebPart by more than 2 seconds.There are many blogs out there which discuss the correct usage of the SharePoint Data Interfaces. GetItem vs. GetItemById is a heavily discussed topic amoung others. The solutions presented on those blogs are basically the same as we have identified with this customer.

Conclusion
The most important thing for SharePoint developers is to really understand whats going on within the Framework (SharePoint) when being used. Someone can really kill performance with inappropriate usage of the different query options that SharePoint provides.

Will post more SharePoint related Performance Topics

Optimizing Remoting by Optimizing Serialization

July 1, 2008 by

RMI Remoting Optimization

Remoting is a key element in modern enterprise applications . While it can help to increase scalabilty and performance it might also become a bottleneck. Especially in highly transactional applications the network easily becomes the bottleneck.

I examined possible performance optimizations in Java RMI following the guidance given in the book Java RMI. The results are very interesting.

I used a simple address service which sends backa number of persons and the countries they live in. The class diagram below shows the structure. The empty BasePerson class is just for presentation purposes. The FastPerson class is used only to override the serialization behaviour.

Class Diagram of Entity Classes

Class Diagram of Entity Classes


I compared a testrun using standard serialization compared to implementing the Externalizable
Interface. Below is the code for custom serialization in the FastPerson class.

@Override
public void readExternal(ObjectInput in)
throws IOException, ClassNotFoundException {
firstName = in.readUTF();
lastName = in.readUTF();
birthdate = new Date (in.readLong());
country = (Country) in.readObject();
} @Override
public void writeExternal(ObjectOutput out) throws IOException {
out.writeUTF(firstName);
out.writeUTF(lastName);
out.writeLong(this.birthdate.getTime());
out.writeObject(this.country);
}

The results below that the performance of the custom serialization is 32 percent faster and sends 21 percent less data. However the effort to implement custom serialization is higher.

Performance Comparision of Standard vs. Custom Serialization

In order to analyse the differences deeper let us take a look at the API breakdown. We can see that the time difference is mainly caused by serialization. The upper charts show the CPU and execution time for standard serialization and the lower charts show the times for custom serialization. The differences in the Client and Address Server layer can be explained by serialization. However they are minimal.

API Breakdown Comparison

API Breakdown Comparison

ConclusionImplementing custom serialization can help to improve response times and reduce network overhead. However additional effort for implementation and maintainance is required. It is best to choose on a case-by-case basis which approach to take.

Lazy vs. Eager Loading in Hibernate

July 1, 2008 by

I recently gave a presentation at Jax 2008 where I talked about common problems on usage of database technologies and O/R mappers.

A general question is on whether to use lazy or eager loading. Generally lazy loading provides advantages as it does not pre fetch all referenced data from the database. However when details are required lazy loading can very easily result in the famous N+1 query problem. The image below shows the result of querying 100 persons and reading their addresses in a loop.

Hibernate Lazy Loading

Hibernate Lazy Loading


To optimize this behaviour I first tried to set the lazy=false attribute in the hibernate mapping file. I expected the behaviour then to be to pre-fetch all addresses and as a result fewer SQL statements. However – as you can see below- the number of SQL statements is still the same. The only difference was that the SQLs are execute before iterating over the persons that during the interation.

Hibernate Eager Loading

Hibernate Eager Loading

This was not the desired result though. I wanted to have only one SQL being executed. To achieve this I had to modify the query using the join fetch keyword. Finally I had my optimized code executing only one SQL statement as you can see below.

Hibernate Eager Loading using Join Fetch

Hibernate Eager Loading using Join Fetch

Got LINQed?

June 30, 2008 by

What is LINQ?
LINQ (Language Integrated Query) is a great set of new features that evolved out of the LINQ Project (http://msdn.microsoft.com/en-us/netframework/aa904594.aspx).
LINQ allows you to execute “SQL Like” queries against different kinds of data sources (.NET objects/lists, SQL, XML).
Its very powerful and it helps developers to query for certain information instead of “hand-coding” loops, if’s and switches.

How fast is LINQ compared to “traditional” looping?
In order to answer this question I implemented a small sample application which creates random objects based on the object model of our GoSpace “Last Minute Offer” Web Service. Here is a short explaination about the Model:
A Travel Offer contains id (int), price (double), Planet, Flight, Accomodation, Meal and Room Type. Planet, Flight, Accomodation, Meal and Room Type are represented as objects. Flight for example further references objects like Ship and SpacePort.

In my sample scenario I created 100000 Offer objects with all its dependant objects. I then implemented the following 4 scenarios with LINQ and with the “standard” approach of simply iterating through the objects:
* Query 1: SELECT all Offers with a price higher than 1000
* Query 2: SELECT all Offers with a Kosher Meal Type
* Query 3: SELECT all Offers to Mars
* Query 4: SELECT all Offers to Mars and return the Flight Information

I configured the sample application with dynaTrace and was not at all surprised that the LINQ version of the queries took longer. It was however interesting that the overhead was between 10% and 30%.

Here is a comparision between the 4 queries with and without LINQ:


Diving deeper into LINQ
I also created a Knoweldge Sensor Pack for LINQ (downloadable in our Community Portal) which shows the internals of LINQ. Additionally to the above mentioned scenarios I executed LINQ queries that used features like aggregation, sorting, …

Here is a sample PurePath of a more advanced LINQ query:

Conclusion
LINQ is easy to use and very powerful. In a simple scenario one has to decide whether a simple nested loop might be the better approach – especially when it comes down to performance.
The Knowledge Sensor Pack will definitely help developers to understand the internals of LINQ and might give them hints to improve their queries.

Instrumenting SQL Server Managed Stored Procedures

June 24, 2008 by

Starting with SQL Server 2005 a database developer has the option to implement Stored Procedures in Managed Code. SQL Server offers a feature which is called “CLR Integration”. A good starting point for additional technical background is the following link: http://msdn.microsoft.com/en-us/library/k2e1fb36(VS.80).aspx

This feature is a great improvment for database developers. Its also possible to debug the managed code when you execute the procedure. The upcoming question for me was: “Can we monitor it in the same way dynaTrace can monitor any other .NET or Java Application?” – the answer is: YES we can!

The CHALLENGE

SQL Server hosts the CLR Runtime and runs it in a special security context. A .NET Assembly that implements a stored procedure can ONLY use certain system assemblies to interact with. By default – the assembly is also restricted in terms of accessing external resources, memory allocations and thread management. These restrications make perfect sense in order to achieve a stable running SQL Server Instance.

The SOLUTION
In order for dynaTrace to work in this environment we have to do several steps and we have some pre-requirements:
a) the database that we want to monitor needs to be “trustworthy”
b) the database owner must own the role to add so called “unsafe” assemblies
c) we have to add several assemblies to the database’s internal assembly cache

The RESULT
With the SQLServerCLR Knowledge Sensor Pack – which can be downloaded from our http://www.dynatrace.com/community – you can now monitor the interactions between the Stored Procedure and SQL Server. Here is a simple stored procedure that executes a SQL Statement and returns its results:

When this Stored Procedure is executed we get the following PurePath with dynaTrace Diagnostics:

Cool Stuff!
So – now we have the option to monitor each Managed Stored Procudure and identify why its not performing as we would like it to.

SharePoint 101

June 18, 2008 by

SharePoint was one of the biggest topics @ MSFT TechEd in Orlando. The interest from the audience was amazing. Most of the sessions have been packed with people that are about to or have already implemented a SharePoint Solution.
There are also many companies that offer SharePoint based Solutions, e.g.: CRM, HR, Finanze, …

Microsoft itself is also starting to use SharePoint Technology as the base of their other Server Products. MS Dynamics CRM and Commerce Server are all going to provide WebParts to integrate with SharePoint.

I thought its time to share some basic information with you regarding SharePoint. Here is a quick 101 that should give you a rough overview of what SharePoint is and what it can do for you:

SharePoint Terminology
WSS: Windows SharePoint Services. Comes with Windows Server and provides base collaboration services
MOSS: Microsoft Office SharePoint Server. Is the Server version of SharePoint. Supports larger installations, supports Portals, Enterprise Serach/Process/Forms and comes with additional Integration Services, e.g.: Excel and InfoPoint
WebApplication: Its the root SharePoint Application which hosts a Site Collection with at least one Site (Root Site). A WebApplication is represented by a Web Site in IIS.
Site Collection: A Site Collection is – as its name implies – a collection of sites. A collection holds one or many sites. A Site collection is also bound to a specific Content Database which stores all documents and items for that Site Collection. An example for a site collection would be all sites for a specific department in your organization.
Site: A Site is a single site within your collection. It can host subsites, lists or pages to display the content stored in the content database.
WebPart: A WebPart is a special ASP.NET WebControl that can be used in a SharePoint Site. There are two flavors of WebParts. There is the basic ASP.NET WebPart and the specialized SharePoint WebPart. SharePoint WebParts extend the basic WebPart functionality with the feature to “connect” to other WebParts on the same page.
Content Database: Each SiteCollection has its own Content Database which stores all lists and documents for the site collection.
Configuration Database: There is one configuration database per SharePoint Server instance. The configuration database contains all information about Site Collections, Sites, Users, …

Useful links
http://www.microsoft.com/sharepoint/default.mspx
http://andrewconnell.com/blog
http://www.sharepoint911.com/Pages/default.aspx