Archive for the ‘Best Practices’ Category

Error Analysis Process: The Weak Spot in Manual and Functional Testing

September 29, 2008

Last week I’ve been at the QAI Quest Testing Show in Toronto, ON. Having a long history in the testing business myself it was interesting to talk with Manual and Functional Testers. We discussed their processes and the tools that they use and how their day-to-day life looks like when interacting with developers about issues that were discovered by their testing efforts.

Whats the typical process when an issues is identified?

Once an issue has been identified – either through a manual test or through an automated functional test – the developer needs to be notified about it. The following steps briefly outline the typical actions:

  1. Tester: Create a new ticket in your bug tracking system
  2. Tester: Describe each step that led to the error
  3. Tester: Attach screenshots that show the problematic part of the application
  4. Tester: Attach additional application and system log files
  5. Developer: Follow the described steps to reproduce the problem
  6. Developer: Request additional information if the problem is not reproducable or if log information is missing
  7. Tester: Providing additional information
  8. Developer: Fix the problem
  9. Tester: Re-test and verify the issue

What are the problems with this process?

The main problems with that process is that

  • Testers have to spend a lot of time to create issue descriptions and collect all the necessary information
  • Developers need to reproduce the problem on their local environment
  • Issues often cycle between Testers and Developers in case issue is not reproducable – lots of time is wasted with this “Ping/Pong” game

How to fix the process?

In order to solve these problems we need a mechanism to automatically capture all the information that is needed by the developers so that testers dont have to collect all the information. The captured information must also not only include the sympton description and how to get there – but must also include the actual problem that happened so that developers dont need to reproduce the problem.

Using a solution like dynaTrace – when executing a manual or functional tests – enables Testers to automatically capture code-level information on the application that is tested for those test steps that actually fail. The captured PurePath includes all information that a developer needs to analyze the problem without having to reproduce it because the PurePath shows the exact problem in the application code in the context of the executed test steps.

Therefore – capturing PurePaths for the executed tests eliminate documentation of the issues as well as the reproduction efforts. It also eliminates the “Ping/Pong” game as the PurePath contains all the contextual information a Developers needs in order to analyze the problem.

Conclusion

Too much time is spent between Testers and Developers to work on issues that have been identified. With the correct solutions in place we can minimize all the tedious work or manual issues documentation and problem reproduction. Capturing diagnostics information on the tested application provides all the information for Developers to analyze and fix the problem without having to request additional information and without reproducing the problem. It saves a lot of time and overhead and frees your valueable resources to do the work they should really do.

Transactional Logging

September 25, 2008

When do we add logging?

In order to analyze problems, developers tend to add additional logging information to the source code. There are different logging frameworks available, e.g.: log4j, log4net, EnterpriseLibrary Logging, … which provide an easy and extensible way to create log files. Logging offers additional insight into what’s actually going on in in the application when it is under load or when it is deployed in production without having a great impact on performance.

Why and when is Logging turned on?

When problems come up in a load-testing, staging or in the live environment, developers either provide a new version of the software including additional logging outputs or ask the Tester/IT Admin to turn up the log-level. The additional logging will then provide more contextual information about why a certain problem, e.g: performance problem or error occured.

Whats the problem with logging?

There is a big downside of logging – which is the amount of data that is produced in a non-contextual manner. Once the log files are available for developers they need to be analyzed and correlated with other log files or other metrics that have been gathered by other tools used in the system, e.g.: load testing or monitoring solutions. Browsing through large logfiles – looking for log entries with particular timestamps and correlating those entries to certain events (performance or functional issues) usually takes a long time and not always result in the discovery of the root cause of the problem.

Transactional Logging: Getting the log information in the right context!

In order to improve root cause analysis based on log file entries log entries should be viewed based on a single transaction of the application, e.g.: a single page request or a click on a button. Knowing which transaction had a problem allows us to only focus on those log entries that are essential for the error analysis.
On the other side we should also be able to analyze certain log entries which indicate a problematic situation – and trace it to an individual transaction. This allows us to identify the transaction flow and why the transaction execution ended up in a problematic situation causing the log entry to be created.

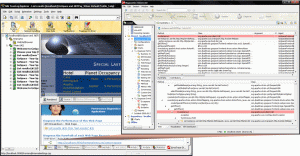
dynaTrace captures log entries of the major logging frameworks along every transaction that is recorded. The log entries show up as PurePath nodes right at the location where the log messages have been created including the log message and severity. With this information its possible to analyze all log messages created for a single transaction – or identify those transactions that logged a certain message. The following image shows how to identify an individual transaction based on a certain log message.

Log Entries identified in a single PurePath

Log Entries identified in a single PurePath


Conclusion

Developers spend a lot of time analyzing problems based on log file entries. Analyzing and correlating values to other measures is a tedious job and takes a lot of time. Offering log entries in the context of a single transaction (web request, user interaction, …) will speed up the root cause analysis.

Performance vs. Scalability

September 11, 2008

When people talk about performance and scalability they very often use these two word synonymously. However they mean different things. As there is a lot of misunderstanding on that topic, I thought it makes sense to have a blog post on it.

One of the best explanations can be found here.  It is a nice explanation by Werner Vogels the CTO of amazon.  I think everybody agrees that he knows what he is talking about.

Performance refers to the capability of a system to provide a certain response time. server a defined number of users or process a certain amount of data.  So performance is a software quality metric.  Unlike to what many people think it is not vage, but can be defined in numbers.

If we realize that our performance requirements change (e.g. we have to serve more users, we have to provide lower response times) or we cannot meet our performance goals, scalability comes into play.

Scalability referes to the characteristic of a system to increase performance by adding additional ressources. Very often people think that there system are scalabable out-of-the-box. “If we need to server more users, we just add additional server” is a typical answer for performance problems.

However this assumes that the system is scalable, meaning adding additional resources really helps to improve performance.  Whether your system is scalable or not depends on your architecture.  Software systems not having scalability as a design goal often do not provide good scalabilty.  This InfoQ interview with Cameron Purdy – VP of Development in Oracle’s Fusion Middleware group and former Tangosol CEO – provides a good example on limited scalability of a system.  There are also two nice artilces by Sun’s Wang Yu on Vertical and Horizontal Scalabilty.

So how does this relate to dynaTrace.  With Lifecycle APM we defined an approach how to ensure performance and scalability over the application lifecycle – from development to production.  We work with our customers to make performance management part of their software processes going beyond performance testing and firefighting when there are problems in production.

As scalabilty problem are in nearly all cases architectural problems, these charateristcs have to be tested already in the development phase. dynaTrace provides means to integrate and automate performance management in your Continuous Integration Environments.

When I talk to people I sometimes get the feedback “… isn’t that premature optimization” (have a look at the cool image on premature optimization in K. Scott Allen’s Blog). This is a strong misconception. Premature optimization would mean that we always try to do performance optimization whenever and wherever we can.  Lifecycle APM and Continuous Performance Management as the development part of it, targets to get all information to always know about the scalabilty and performance characteristcs of your application. This serves as a basis for deciding when and where to optimize; actually avoiding premature optimization in the wrong direction.

Concluding we can say that if we want our systems to be scalable we have to take this into consideration right from the beginning of development and also monitor throuhout the lifecycle.  If we have to ensure it, we have to monitor it. This means that performance management must then treated equally relevant than the management of functional requirements.

Borland SilkPerformer and dynaTrace – Loadtesting and Diagnosis

August 27, 2008

We have already discussed several integration of dynaTrace with other tools. Today i will focus on our integration with Borland SilkPerformer.  This integration is the “oldest” and also deepest integration of dynaTrace into a loadtesting tool.

The integration with Borland SilkPerformer  allows to automatically jump directly from the TrueLog Explorer which shows a visual representation of the web pages received by a virtual user to the respective transaction in the dynaTrace Client.

Driil down from SilkPerformer True Log to dynaTrace PurePath

Driil Down from SilkPerformer True Log Explorer to dynaTrace PurePath

dynaTrace also automatically correlates the timer names uses by SilkPerformer in the Tagged Web Requests View. This allows to instantly correlate a business level request like the ordering of goods to an actual Web request.

SilkPerformer Web Requests in dynaTrace

SilkPerformer Web Requests in dynaTrace

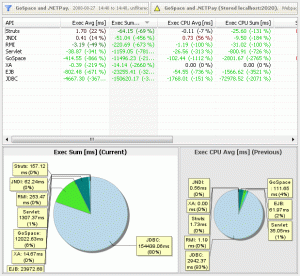
The integration also allows to directly jump from a load testing report to a dynaTrace Diagnosis View. If we discover a slow web page as shown below we can instantly drill down to the API breakdown of this specific request type. This tight integration enables a very fast problem triage and allows QA to quickly isolate performance problems and get in touch with the right people. Additionally the dynaTrace SilkPerformer integration allows to integrate any metric collected by the dynaTrace Server into a loadtesting report.

Drill Down from SilkPeformer Load Test Report to dynaTrace API Breakdown

Drill Down from SilkPeformer Load Test Report to dynaTrace API Breakdown

Session recording for continuously executed load tests can easily be diffed using the dynaTrace diffing functionality. This allows to easily and fast pinpoint performance regression problems.

Diffing of API Breakdowns of Two Load Tests

Diffing of API Breakdowns of Two Load Tests

In a previous article I mentioned using horizontal and vertical slicing to reduce the amount of collected data.  SilkPerformer provides out-of-the-box support for horizontal slicing based on the ability to selectively enabling capturing of PurePaths.

Conclusion

When considering a sophisticated load testing solution with perfect integration with dynaTrace Borland SilkPerformer is an excellent choice. Deep integration and automation enalbes QA to isolate performance problems faster and at the same time get more productive due to higher automation support

Continuous Performance Management in Development

August 26, 2008

Continuous Integration has become a well established practice in todays modern software development. Especially for enterprise applications – that face the architectural challenge of dealing with a highly distributed and heterogeneous environments – its more necessary than ever to establish and enforce these kinds of practices.

Aren’t Automatic Builds, Unit- and Integration Tests enough?
How often have you been facing the situation that the latest integration build has passed all the tests but the first smaller load or stress test uncovered huge performance problems?
Wouldn’t it be better to not only test your code on functional correctness but also verify the performance?
Wouldn’t it be better to verify the latest code changes against well established architectural practices?
Wouldn’t it be better to trace performance values across your builds in order to react on degradations?
If you have answered at least one of the above questions with YES I encourage you to continue reading.

Continuous Performance Management (CPM)
Last weekend I had the chance to discuss this topic with several attendees and speakers at devLink.
Testing the performance & scalability of components as well as verifying your architecture in the early stages of your application development seemed to be the next logical step forward in order to create software that not only works – but works reliable and fast enough.

The goals of CPM are:

  • Constant Monitoring of Software Performance
  • Find Root Cause of Performance Variances before too much time passes
  • Fix Performance Issues before they are passed on to the next stage in the Lifecycle

Why do we need CPM?

  • Because GREEN Unit Test results don’t mean your components are really GREEN
  • It helps you to do Performance & Architecture Validation early in the Application Lifecycle

CPM with dynaTrace

For my sample application I’ve written several unit and web tests that verify if my application is functionally correct. I let those tests execute for each individual build that I run and it seems I am doing a good job – everything is GREEN on my machine.

In order to enforce CPM I use dynaTrace to achieve two goals:

  1. Verify that my unit tested components perform within expected thresholds, e.g.: a certain web service should not take longer than 500 milliseconds
  2. Verify that my unit tested components apply to well established architectural rules, e.g.: no component should execute more than 50 SQL Statements nor should there be the same statement executed multiple times

Set-Up
I use the dynaTrace MSBuild or NANT task to integrate dynaTrace into my Continuous Integration Process. I also create alerts for my performance thresholds on my web services and create additional alerts to enforce several architectural rules

Execution
For every build that I execute dynaTrace automatically raises incidents in case the performance degraded or if I do not meet my own set architectural standards. dynaTrace session are automatically stored for each build to allow me comparing my results across builds in order to react to performance degradation.

For every unit test I therefore get full visibilty into the code that is actually executed – allowing dynaTrace to root cause performance and architectural problems, e.g.: too many DB Statements. The following shows the PurePath for one of my unit tests.

Unit Test that uncovered performance & architectural problems

After I started fixing the problem in my application code I can now make use of the difference views of dynaTrace in order to analyse performance across my builds.

Performance Regression across Builds

Conclusion

dynaTrace is easy to integrate into your Continuous Integration Process in order to manage the performance of your components early in the Lifecycle. But Performance Management doesnt stop here. We can apply those principles across the Lifecycle to achieve Lifecycle Application Performance Management.

Performance Analysis in Load Testing

August 11, 2008

Collection diagnostics information in Load Testing is a challenging task. Using dynaTrace it is possible to collect in-depth code level details with minimum performance overhead. However, although the performance overhead is low, collecting every single detail results in a huge amount of collected data. For 24 hour load tests this can be up to tens of gigabytes. In stress test scenarios which target to bring an application to it’s limits collecting every single detail will even be impossible.

In this post I will introduce two possibilities how to reduce the amount of collected data while still getting all required diagnosis information. These techniques are called slicing techniques as the collect only a part of the data. Depending on which strategy is chosen, we differentiate two slicing techniques

Horizontal Slicing

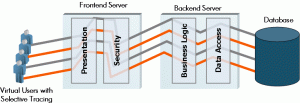
Horizontal slicing means that only transactions of specific virtual users are tracked. Following this approach it is possible to track in depth details for all application components while restricting overhead and keeping the amount of collected data in manageable limits. dynaTrace supports horizontal slicing, by selectively tracing transactions based on whether the dynaTrace HTTP header is sent. Only transactions having this header set will be recorded.

Horizontal Slicing in Load Testing

Horizontal Slicing in Load Testing

Vertical Slicing

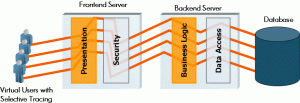
Vertical slicing means that all transactions of the application are monitored, but only for a specific component. This approach allows to track details for each single execution. dynaTrace allows to enable details for specific components at runtime. Switching the component details at runtime allows to gather detailed performance metrics to be used in performance regression testing.

Vertical Slicing in Load Testing

Vertical Slicing in Load Testing